
We live on quite a small island, so we’ve probably always needed to make difficult decisions about how we use our land. But this decade it feels like we have really upped the ante with a set of new, competing priorities. For example:
To alleviate the housing crisis, the (ex) housing secretary has said we need to “build baby build” (more houses)
To achieve clean power by 2030 we’ll need loads of new power lines, solar farms, nuclear power stations and onshore wind.
Because of the Ukraine war, the NFU says it’s a national security priority to grow much more of our own food.
And the environmentalists - including me - would like to make more space for nature, so the government has (somewhat vaguely) promised to protect 30% of the country for nature by 2030.
Back in 2022, the House of Lords clocked that the many simultaneous demands being put on land might become an issue and recommended that government start thinking about this in a more strategic way. They suggested the government create a sort of ‘Land Use Framework’. Henry Dimbleby (founder of Leon restaurants and non-exec Director at Defra at the time) said we should do it too, in his excellent National Food Strategy. Lots of people agreed that this was a smart idea.
Defra decided to take them up on their recommendation. They launched a consultation on a Land Use Framework in 2025, then published a final report earlier this year. Not to be outdone, Scotland published one too. There are some good ideas in these reports (and some quite fluffy ones). So far though, they have not tangibly influenced policy in areas like planning or land use subsidies. But I do think they have the potential to help us to use land in a smarter way in the future – for example by better targeting land use subsidies and tax reliefs (see the “Aligning incentives with spatial priorities” section on page 40).
I think the coolest part of the land use framework is actually in the analytical annex to Defra’s original consultation report. Starting on page 29, there’s a series of beautiful bivariate choropleth maps that compare the suitability of land across the country for different uses. Hats off to whoever in Defra made these - they are great.
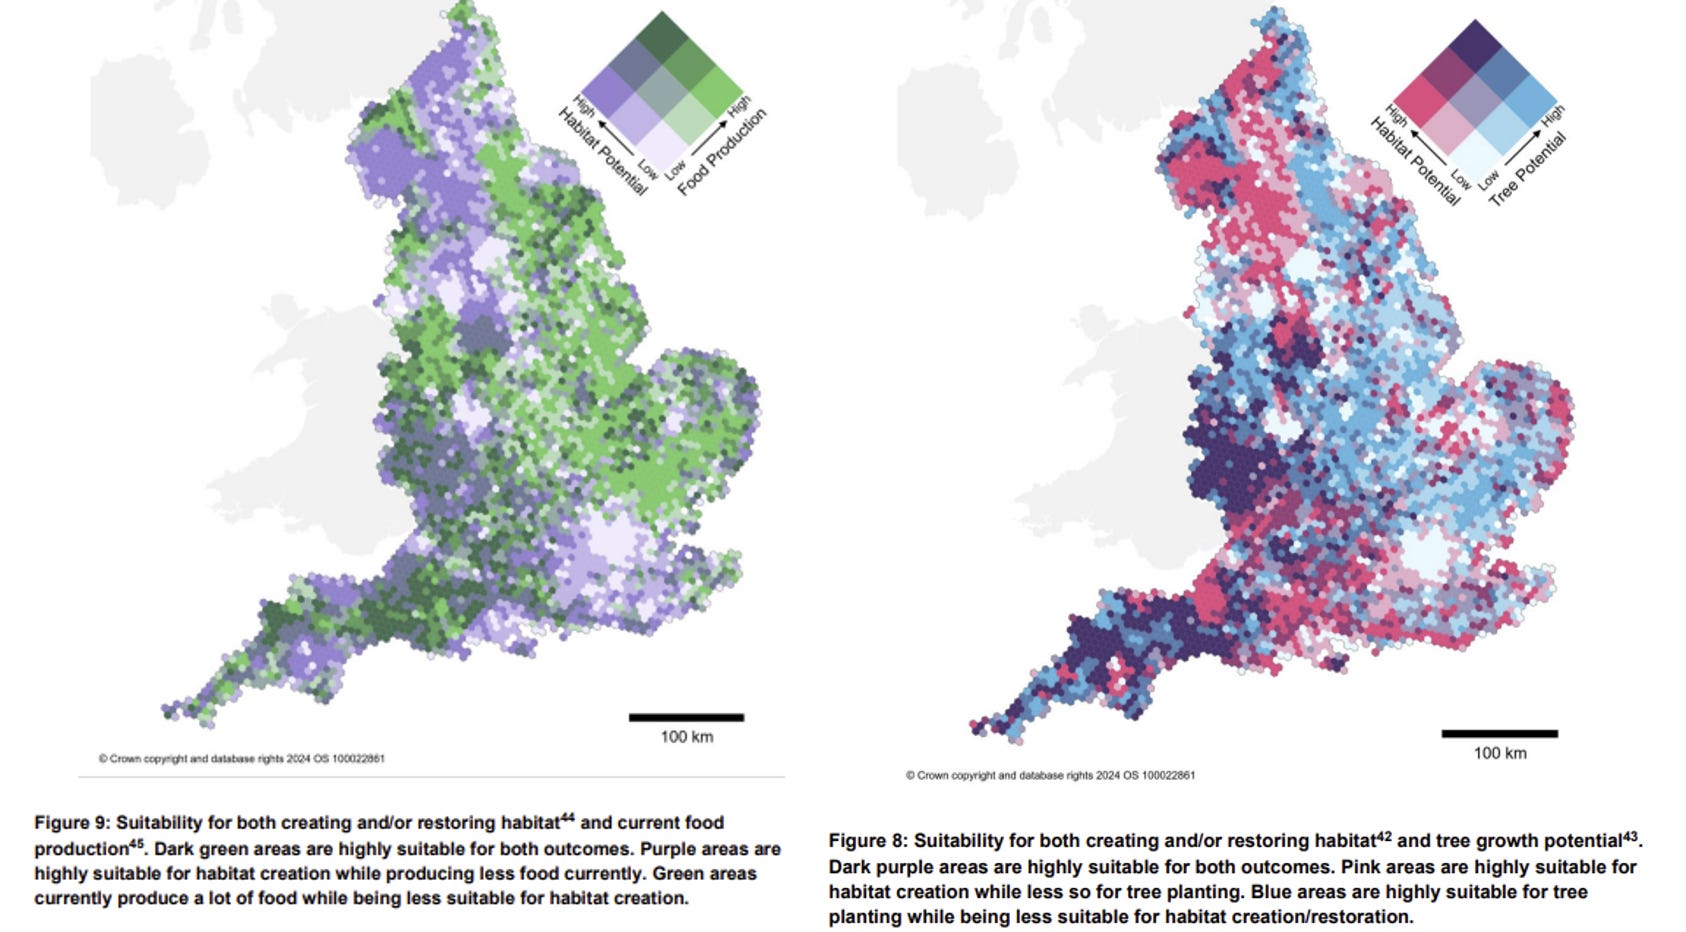
The problem is that they are just static images in a PDF report. It would be really neat if there were an actual tool that people could use to visualise competing land uses in this way.
So I made GBLandUse.org !
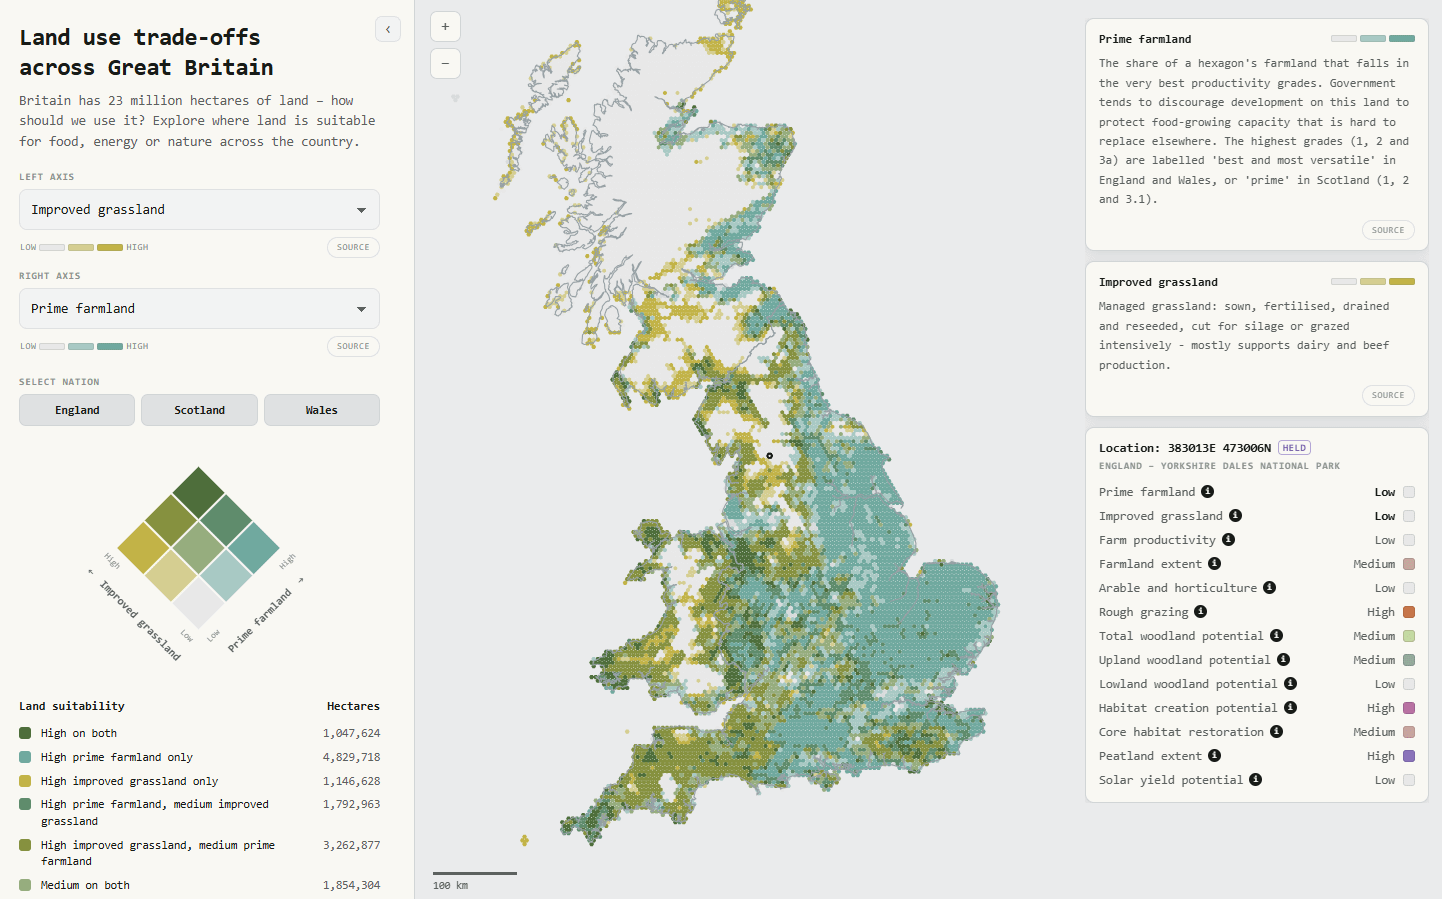
I basically copied Defra’s style of bivariate maps and added in a bunch of other options. At the moment, readers can choose from thirteen land use layers – like farm productivity, woodland creation potential, peatland, solar yield etc – and the site will compare the suitability of land for each of these across the country. Defra’s maps only covered England, and Scotland didn’t really use maps in its land use framework (oddly), but GBLandUse covers all three nations (where the data is available).
Here’s a 30 second video showing how it works:
The full methodology behind the site is described here. I should say that this is an independent tool – it’s not endorsed in any way by Defra or ScotGov.
My favourite maps
I think a few of the maps are particularly striking.
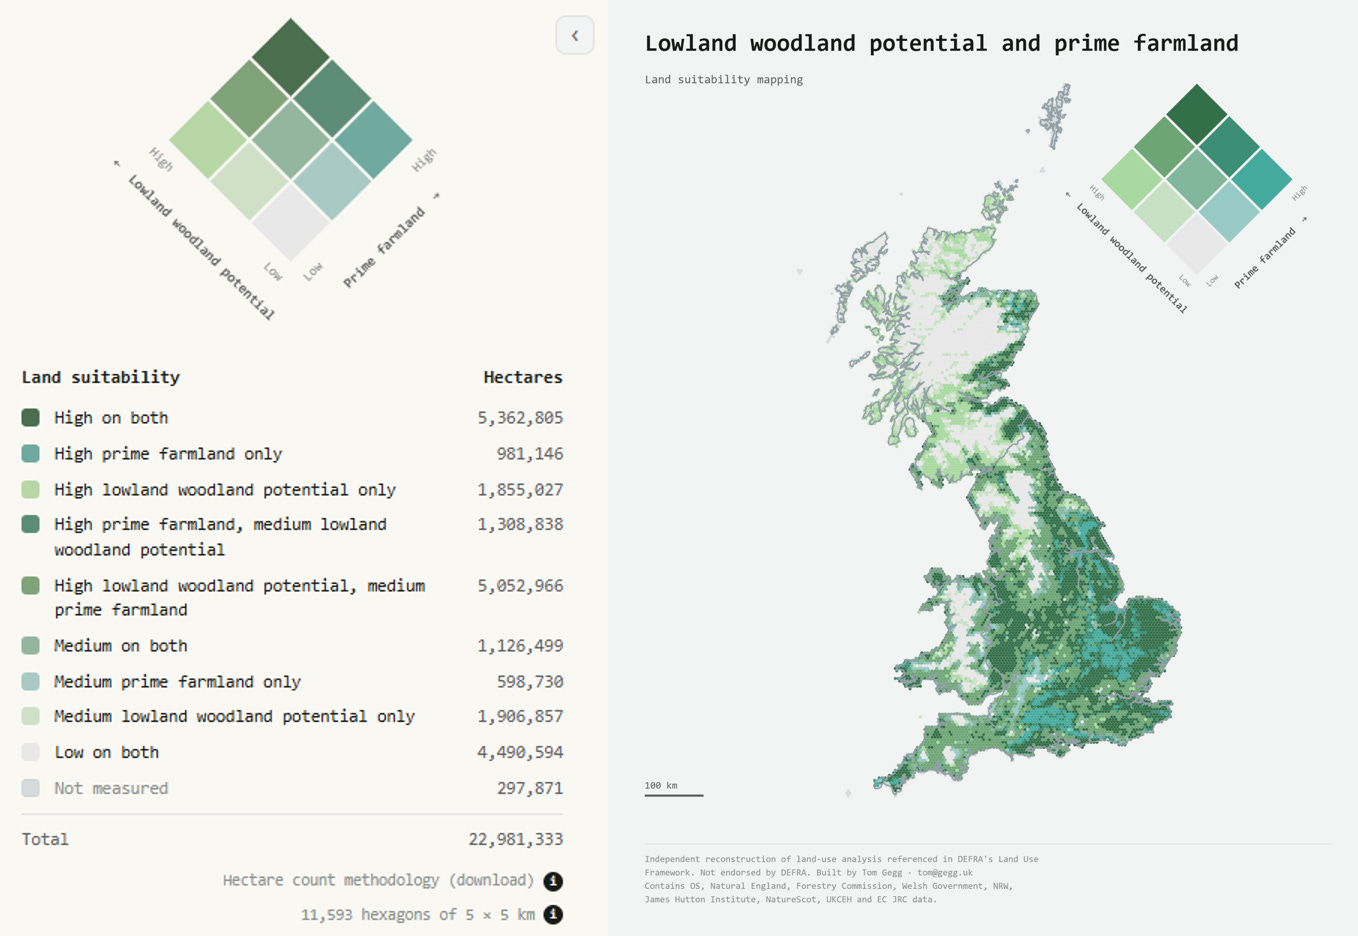
This first one (above) compares Britain’s prime agricultural land with the areas that could be planted with native lowland woodland. There is a very high degree of crossover here: 5.3 million hectares score very well on both agricultural productivity and lowland woodland potential. But this is a trade-off we probably do not want to make in favour of nature – we should be using Britain’s best quality farmland to produce as much of our own food as possible.
But this next one (below) shows that there is surprisingly little crossover between Britain’s prime farmland and some of our other excellent habitat restoration opportunities. The red layer is based on Natural England’s priority habitat network model, which shows where we could restore or expand existing reserves of semi-natural habitats. These are mostly heathlands, bogs, fens, species-rich grasslands, saltmarshes and some ancient woodlands. The biggest crossover between prime farmland and Natural England’s map seems to be in Hertfordshire, which apparently has quite a lot of heath and chalk stream habitat fragments dispersed throughout some very good grade 2 farmland.
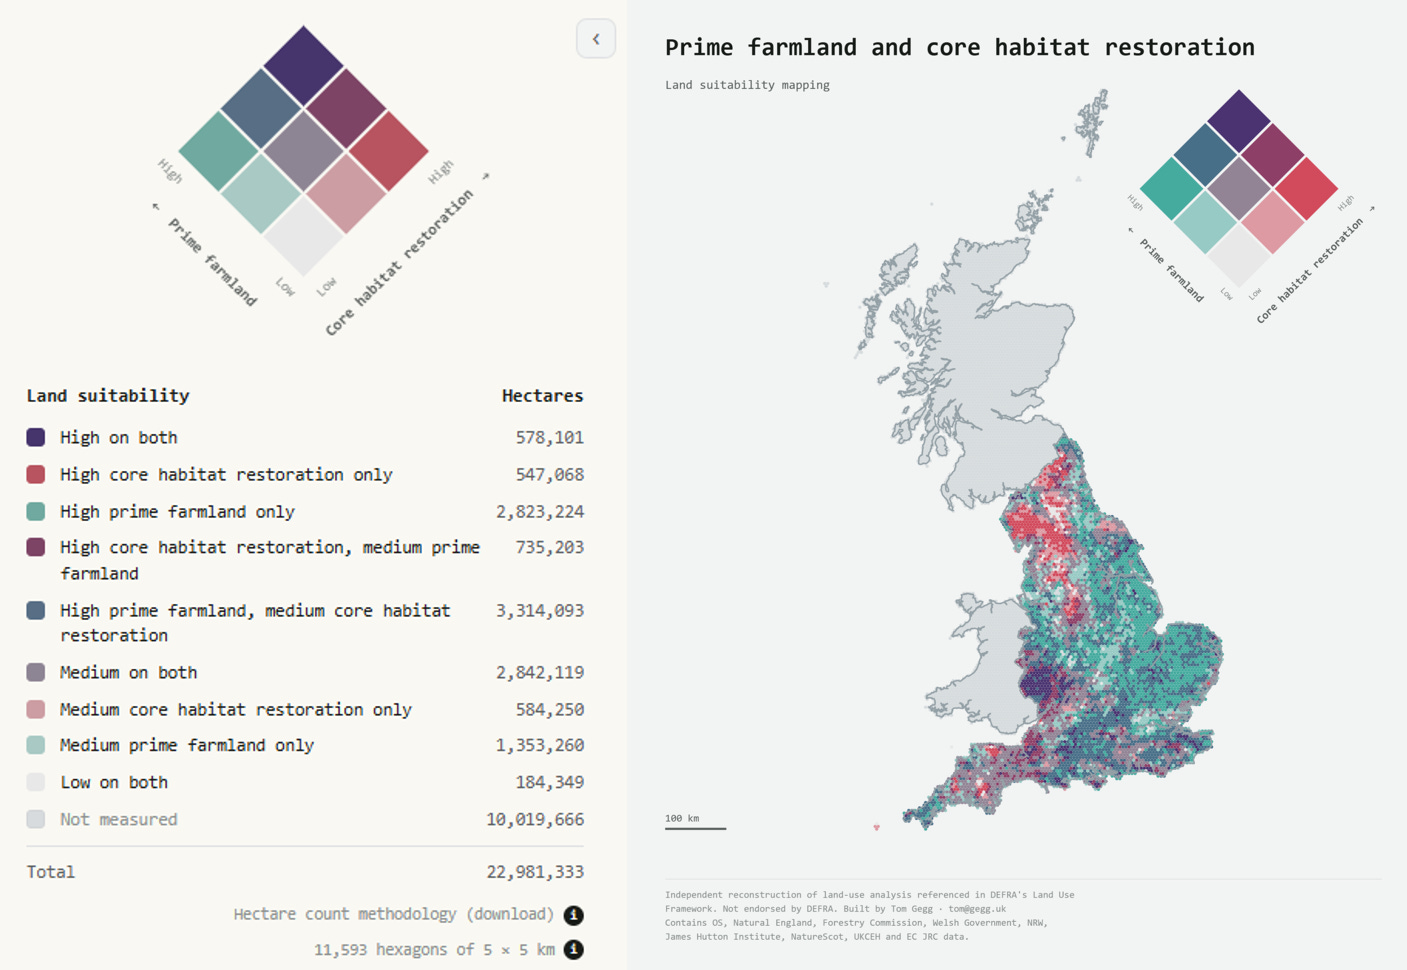
The map shows that, in theory, a trade-off decision could be made in favour of nature. We have over 1 million hectares of opportunities to restore England’s priority natural habitats without sacrificing any prime farmland:
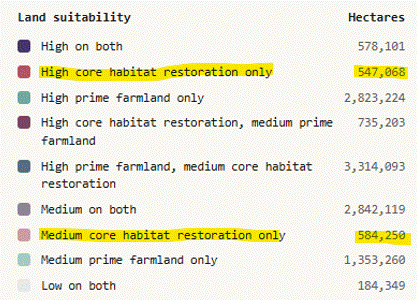
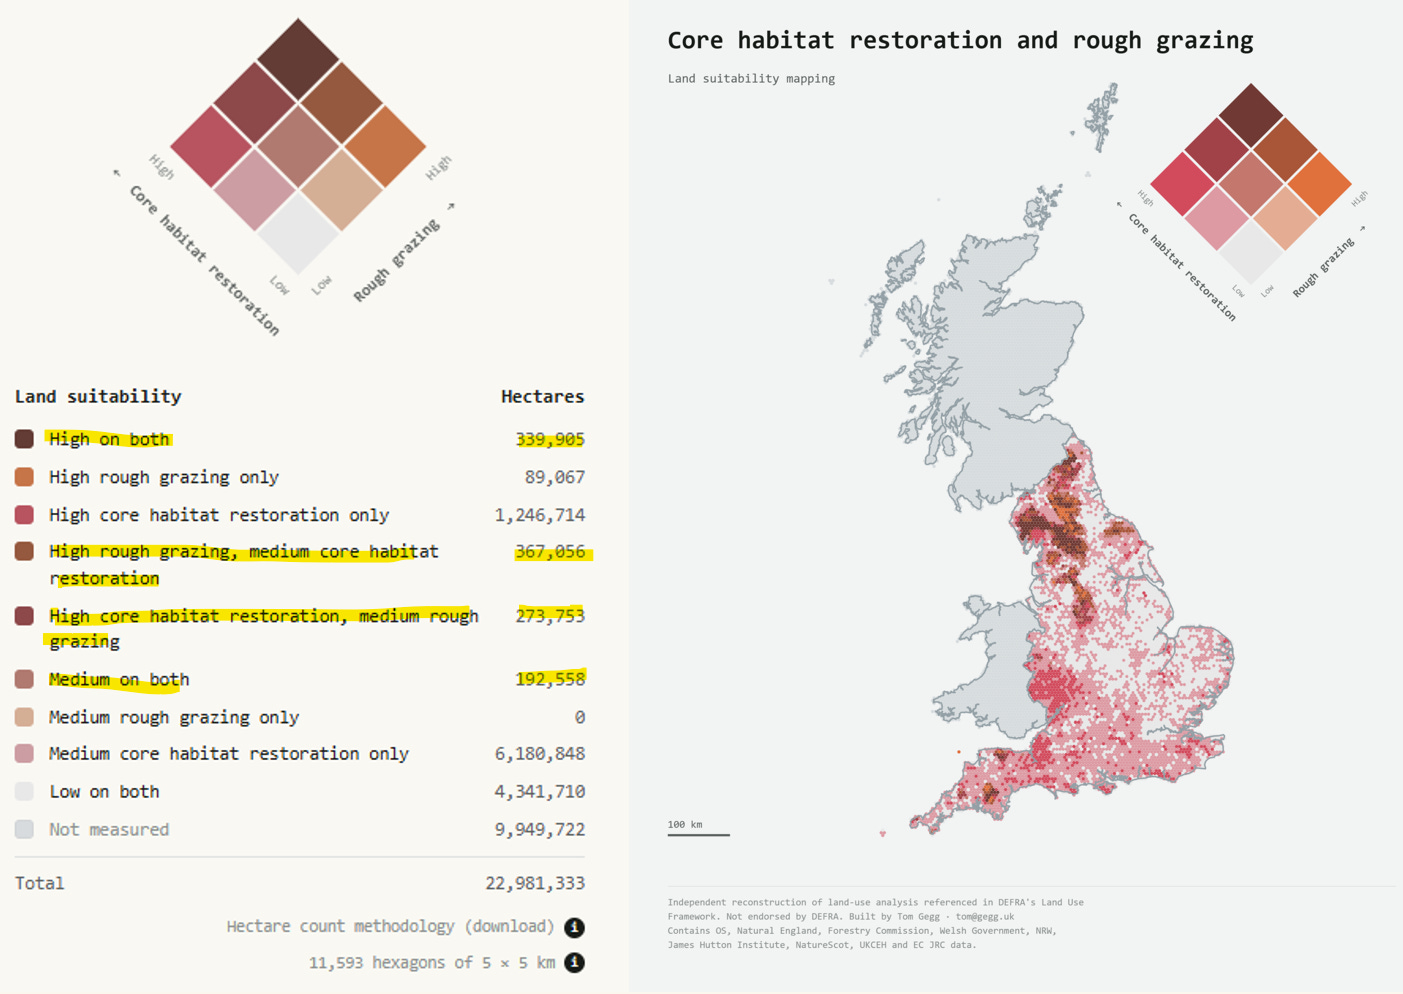
That’s not to say that there is no trade-off to be made at all. While it’s not prime farmland, we do currently use quite a lot of this land for the rough grazing of sheep and cattle (see map below). This can be a difficult type of farming because the land isn’t very productive – hill farming businesses are consequently often loss-making and have historically been heavily supported by government subsidies. I’ve talked about this in another essay, but it’s useful to visualise it on a map too. Across England alone, there are over 1 million hectares of land currently used for rough grazing that we could set aside for priority habitat restoration. As these farms don’t produce very much food, changing how we use this land wouldn’t have a very significant impact on food security – so I think it could be a trade-off worth making. (That’s not to say that all the livestock should go: low-intensity grazing of some animals, such as rare breed cattle, will in some cases be exactly what’s needed for these habitats to thrive).
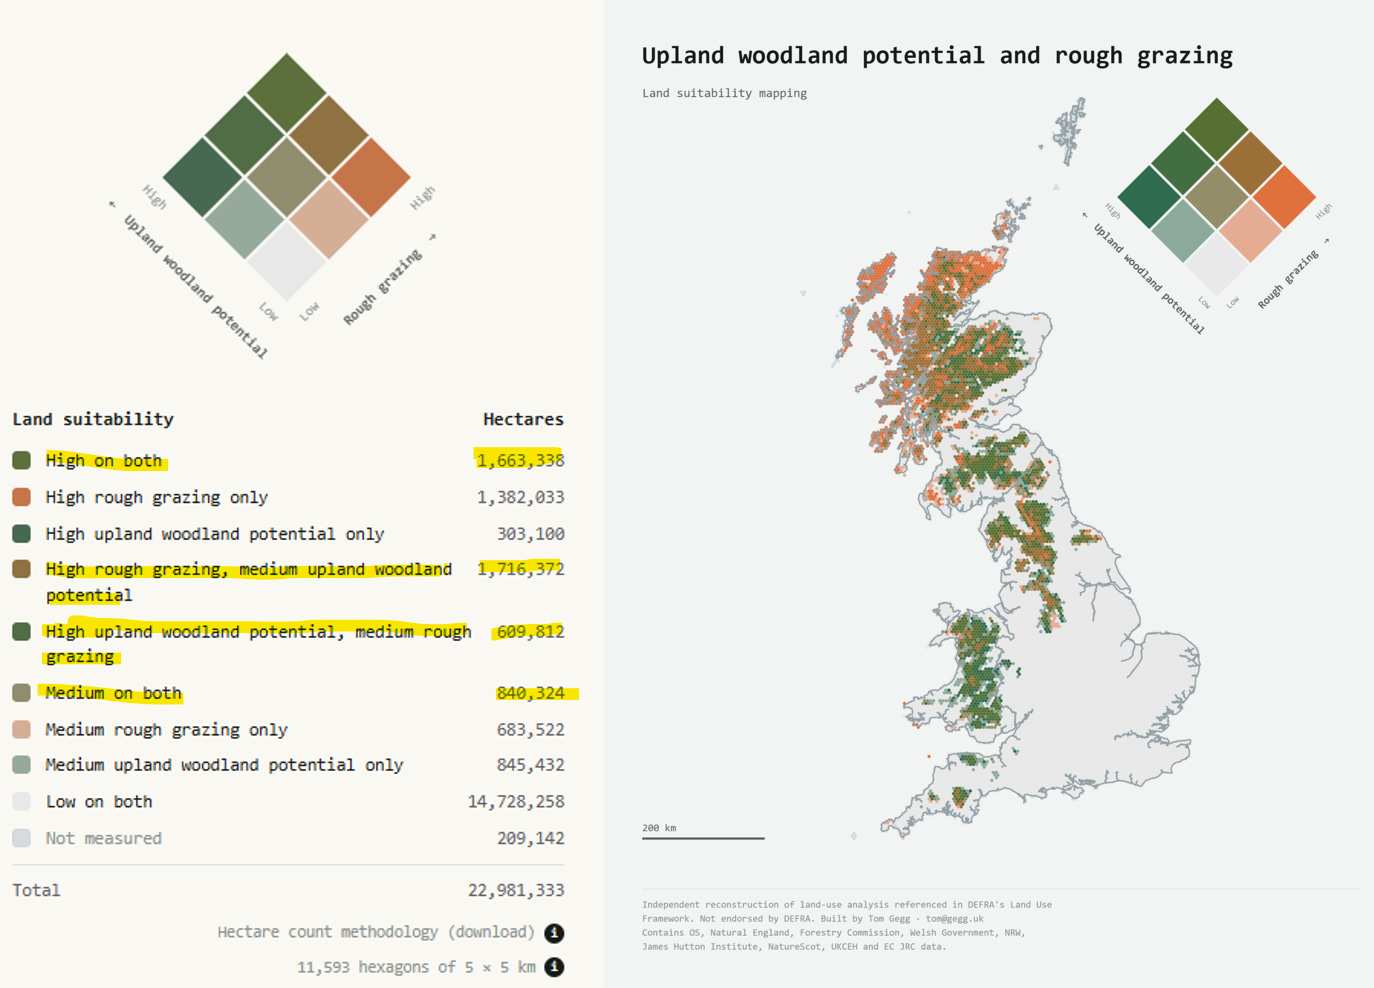
This last map (below) compares the land we currently use for rough grazing across England, Scotland and Wales with the parts of the country that show good potential for new upland woodland creation. While we shouldn’t be trying to plant trees on the peatland at the top of our uplands, a lot of the land beneath the moorland line would be a great place to plant some more trees – though to do that we would probably need to remove the sheep from these areas. That’s a similar trade-off decision to the one I mentioned above, but this time it would be making space for new woodland habitats as well as the heathland and bogs prioritised by Natural England.
Those are the four maps that I personally have found most interesting. But maybe you’re interested in other things - like comparing solar yield potential with improved grassland areas, or mapping priority habitats with existing peatland extent. I’d particularly like to add some layers for house building and infrastructure potential too - if anyone knows any good datasets then please let me know.
Hopefully it’s a useful website! If you have ideas for how it could be improved or things I should add, please write to me at tom@gegg.uk.